See What Your Workflow Was Thinking: Surfacing Component Logs in ByteChef
On this page
TL;DR: ByteChef's Logger component could always write log messages - but they vanished into the server console, where workflow builders could never see them. We fixed that by capturing log calls at the layer every component passes through, storing them per execution, and exposing them in a new Logs tab in both the workflow builder and the execution history. Every component's logs - not just Logger's - now show up next to the step's Input and Output, with level badges, JSON pretty-printing, and expandable stack traces.
Every automation platform eventually gets this ticket. Ours was issue #2896, and it was refreshingly short:
As a Workflow Developer, I want to see logs from the Logger component in the workflow builder and workflow executions, so that I can see details of how my workflows are executing.
ByteChef has had a Logger component for a long time. You drop it between two steps, give it a message - usually with a few data pills in it - and pick a level: Debug, Info, Warn, or Error. That's the whole component.
The problem: the message went to the server log and nowhere else. If you self-hosted ByteChef and had shell access, you could tail the server log and find it. If you were a workflow builder working in the UI - the person the Logger component exists for - it went into a void. The component technically worked and was practically useless.
Deciding Where to Capture
The obvious fix would have been to special-case the Logger component: make it return its message as step output, or write to some Logger-specific store. We went a different way, and it's the decision the whole feature hangs on.
Every component action in ByteChef receives an execution context, and that context's logging method is the sanctioned way for any component to log - the HTTP client logs request failures, Script components log from user code, AI components log token usage warnings. All of those messages were equally invisible.
So instead of touching the Logger component at all, we instrumented the logging implementation inside the component context - the single funnel that every log call in every component already passes through. Each message still goes to the server log like before, but now it also becomes a structured entry: timestamp, level, component name, operation, the step it came from, the message, and - when there is one - the exception type, message, and stack trace.
Because the capture point sits below every component, the feature ships for all 180+ components at once. The Logger component didn't change by a single line. It just became visible.
Storing Logs: One File per Execution
Logs are append-heavy, read-rarely data with an obvious partition key: the job - a single workflow execution. That ruled out a database table. We didn't want every workflow run inserting rows into PostgreSQL for data that's mostly never queried.
Instead, each job gets one file in ByteChef's existing file-storage abstraction, which means logs land wherever your deployment already puts files - the filesystem, a database blob, or S3-compatible storage. The format is JSON Lines: one JSON object per line, so appending an entry is just serialize-and-append.
Two properties of the writer matter more than they look.
First, writes are asynchronous. Logging must never slow down the workflow itself - a component that logs five times shouldn't pay five rounds of storage I/O on the execution path. Java 25's virtual threads make that fire-and-forget pattern nearly free.
Second, the read path is guarded by the same permission model as everything else that touches executions. Logs frequently contain payload data - that's the point of logging them - so they inherit the exact visibility rules of the execution they belong to. If you can't see the run, you can't see its logs.
Two Environments, Two Pipelines
There's a wrinkle: ByteChef has two kinds of "execution". There are production runs of deployed workflows, and there are test runs you trigger with the Test button while building a workflow in the editor. Test runs are ephemeral - their logs shouldn't accumulate in long-term storage next to production history.
So the feature is split down the middle. Production runs write to the long-term log area and are served to the execution history view. Editor runs write to a separate area with their own cleanup, served by a parallel query. The context factory decides which writer a component gets based on which environment it's running in, and the client picks the matching query. Same UI, same log format, different lifecycle.
The Read API
The read API is GraphQL, matching where the rest of ByteChef's newer client-server surface has been heading. It supports pagination and filtering from day one: minimum level, component name, a specific step, a time range, and free-text search.
The per-step filter is what powers the most-used view: click a node in the execution panel and you see only that step's logs. Look at the job as a whole and you see everything, with a small component-name chip on each row so you can tell who said what.
The Logs Tab
On the client, the execution detail panel - the one with Input and Output tabs you get when you click a step - gains a third tab: Logs.
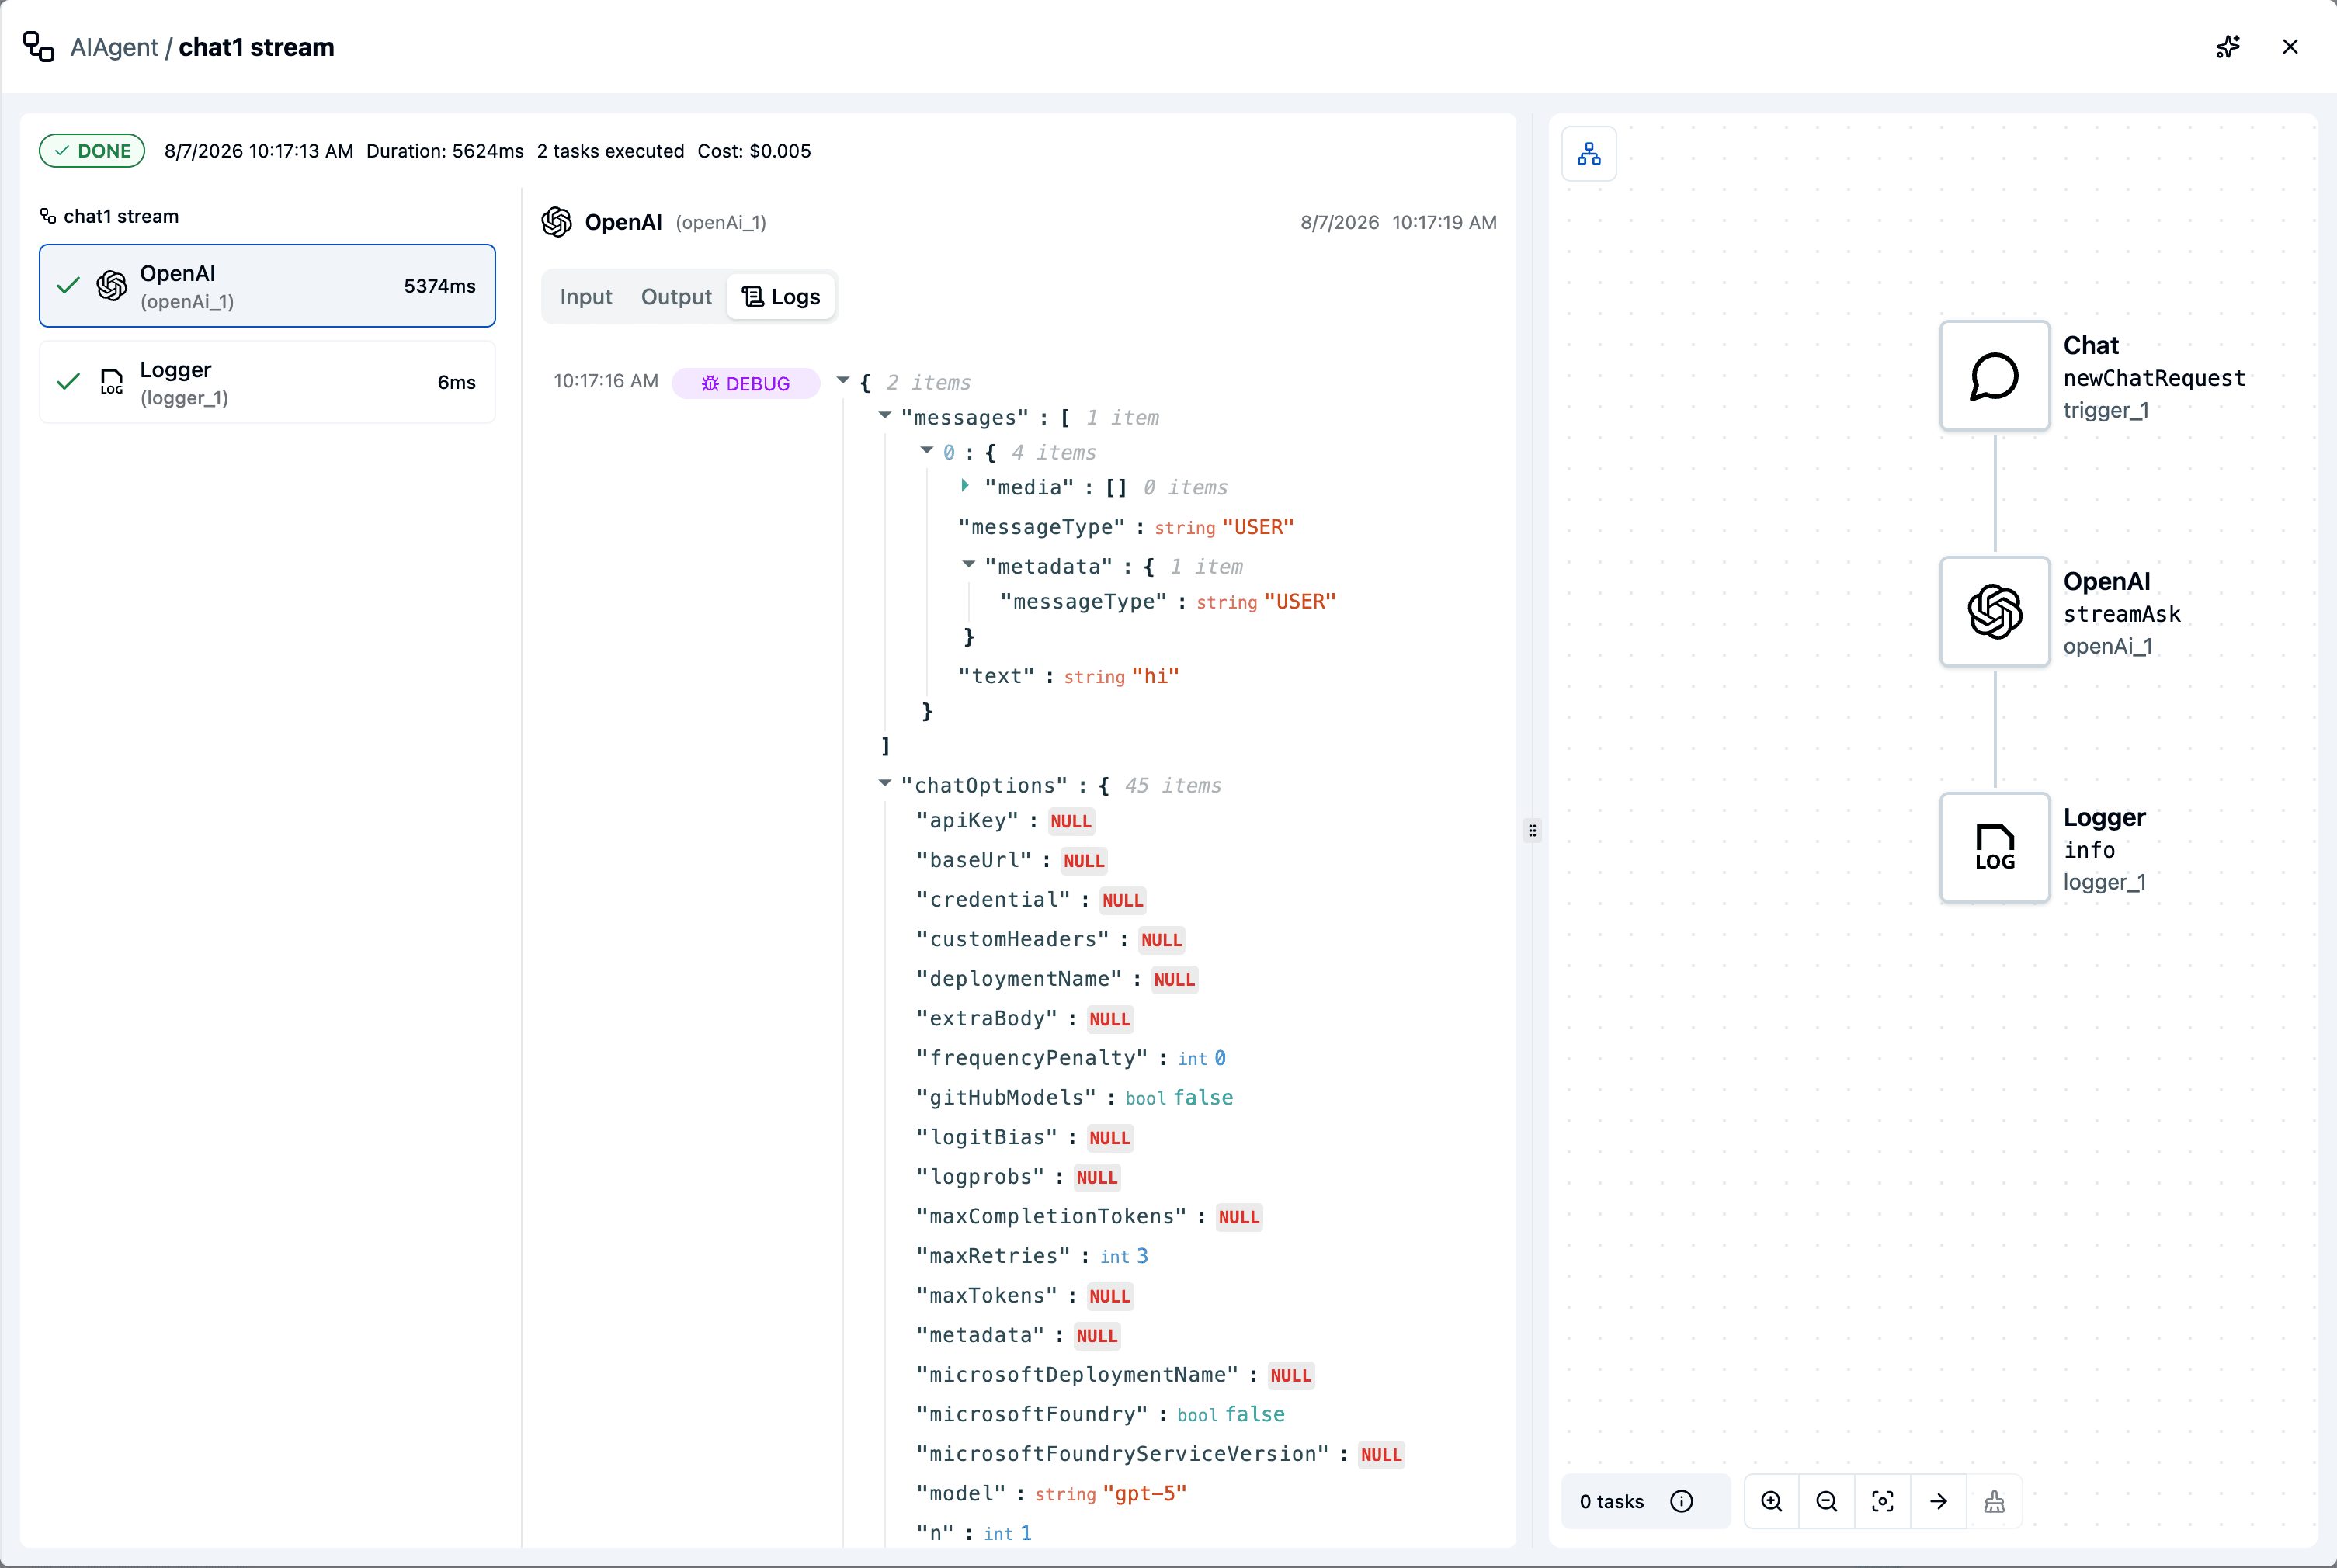
That's a real run above - and it's worth noting whose log you're looking at. The workflow has a Logger component in it, sitting right there in the graph on the right. But the entry on screen came from the OpenAI step, which logged its outgoing request without anyone asking it to. That's the capture-one-layer-down decision paying off in a screenshot: the component that made the ticket necessary isn't even the one being shown.
Each row shows a timestamp, a colored level badge (blue INFO, purple DEBUG, yellow WARN, red ERROR), and the message. Two small touches make it feel finished rather than bolted on:
JSON detection. People constantly log entire objects - dumping a payload into a log line is a very common debugging move. If a message parses as JSON, the tab renders it with the same collapsible tree viewer we use for step outputs, instead of an unreadable one-liner.
Expandable errors. When an entry carries exception details, the row becomes clickable and expands into the exception type, message, and full stack trace - so a failed step's story is readable in place, without asking an operator to grep the server log for you.
And because the editor pipeline exists, the same tab appears in the workflow builder's test output panel. Run a workflow with the Test button, click a step, open Logs - the feedback loop that issue #2896 asked for, closed.
One Layer Down
The lesson we're taking from this one: when a ticket says "make the Logger component's output visible", the right fix might be one layer down. By instrumenting the context instead of the component, a request about one component became execution-level observability for every component in the platform - including the ones we haven't built yet.